The Project
Community sports leagues live and die by their volunteers—the people who rake the infield before games, organize equipment, and keep everything running smoothly. When Northbridge, Massachusetts decided to launch an ambitious new Men’s Fall Softball League, they wanted to elevate beyond the typical recreational setup: professional umpires, properly maintained fields, corporate sponsors, and most notably, comprehensive player statistics.
The league organizer, who also participated in an established softball league in neighboring Upton, secured Parks & Recreation budget to launch the pilot season and reached out for help building a statistics platform. The goal was simple: create a system that could track individual and team performance across games and seasons, making the league feel more legitimate while giving players the data they’ve always wanted to see.
The Challenges
- Complex statistical calculations – The system needed to handle real-time compilation of both basic stats (batting average, on-base percentage) and advanced metrics (slugging percentage, weighted metrics) across individual games, full seasons, and career totals
- Efficient bulk data entry – With 70+ players across four teams generating statistics weekly, the platform required streamlined tools to enter game schedules and player performances without hours of manual admin work
- Flexible scheduling – Rain-outs and makeup games needed to integrate seamlessly into the schedule without breaking the entire system when games were postponed by one week or five
The Process
The Data
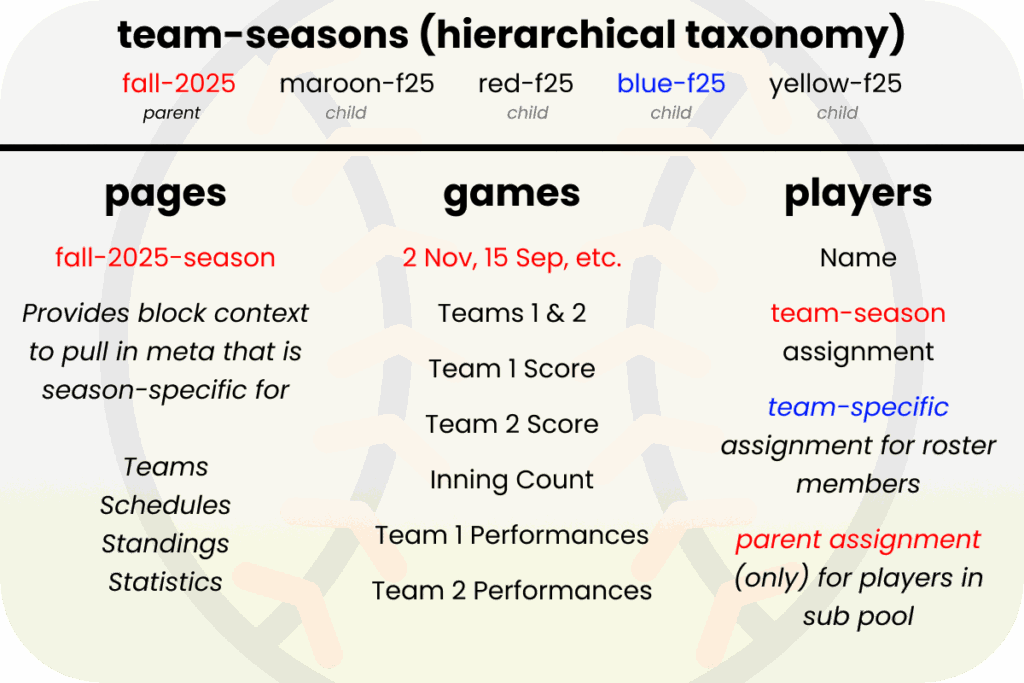
The architecture revolves around a hierarchical taxonomy called team-season that connects all content types together:
Parent level (example: fall-2025)
- Season homepage pages are tagged to the parent
- Individual games belong to the parent season
- Players without team assignments (the substitute pool) are tagged to the parent
Child level (example: red, blue, maroon)
- Each child represents a specific team within that season
- Teams carry attributes: coach name, team colors (background/text), abbreviation, and sponsor
- Players are tagged to their team’s child taxonomy
This tagging system allows custom blocks to infer context automatically. When viewing a player’s profile with a season parameter, the system knows which team they played for, what their stats were, and can brand the page accordingly—all without hardcoding relationships.
Games themselves carry multiple attributes: date, time, two competing team-seasons, scores for each team, number of innings, and the winner. Each game also contains “performances”—the individual statistics for every player who participated.
The league agreed on a focused stat set that could be tracked consistently: plate appearances, at-bats, hits, runs, doubles, triples, home runs, walks, and strikeouts. Each week, statistics were compiled from scorebooks and entered into the system.
To handle the data entry burden, three CSV import tools were built:
- Bulk player creation (adding all 70+ participants at season start)
- Bulk game scheduling (uploading the full season calendar with dates and times)
- Bulk performance entry (copy-paste from spreadsheets, reducing weekly stat entry to under ten minutes for all four teams)
One architectural decision worth noting: player performances are tied to games, not teams. This means substitutes can play for any team and have their statistics properly tracked. During the fall season, teams regularly borrowed players from each other or picked up subs from the pool, and the system handled it without special cases.
The Design
The visual approach remains deliberately simple, built on four template types:
Season Homepage – Shows current standings, lists all teams, displays the schedule, and aggregates season-wide statistics
Team pages – Team rosters, upcoming schedule, recent results, current record and standings position
Game pages – Final score headline with boxscore tables for both teams
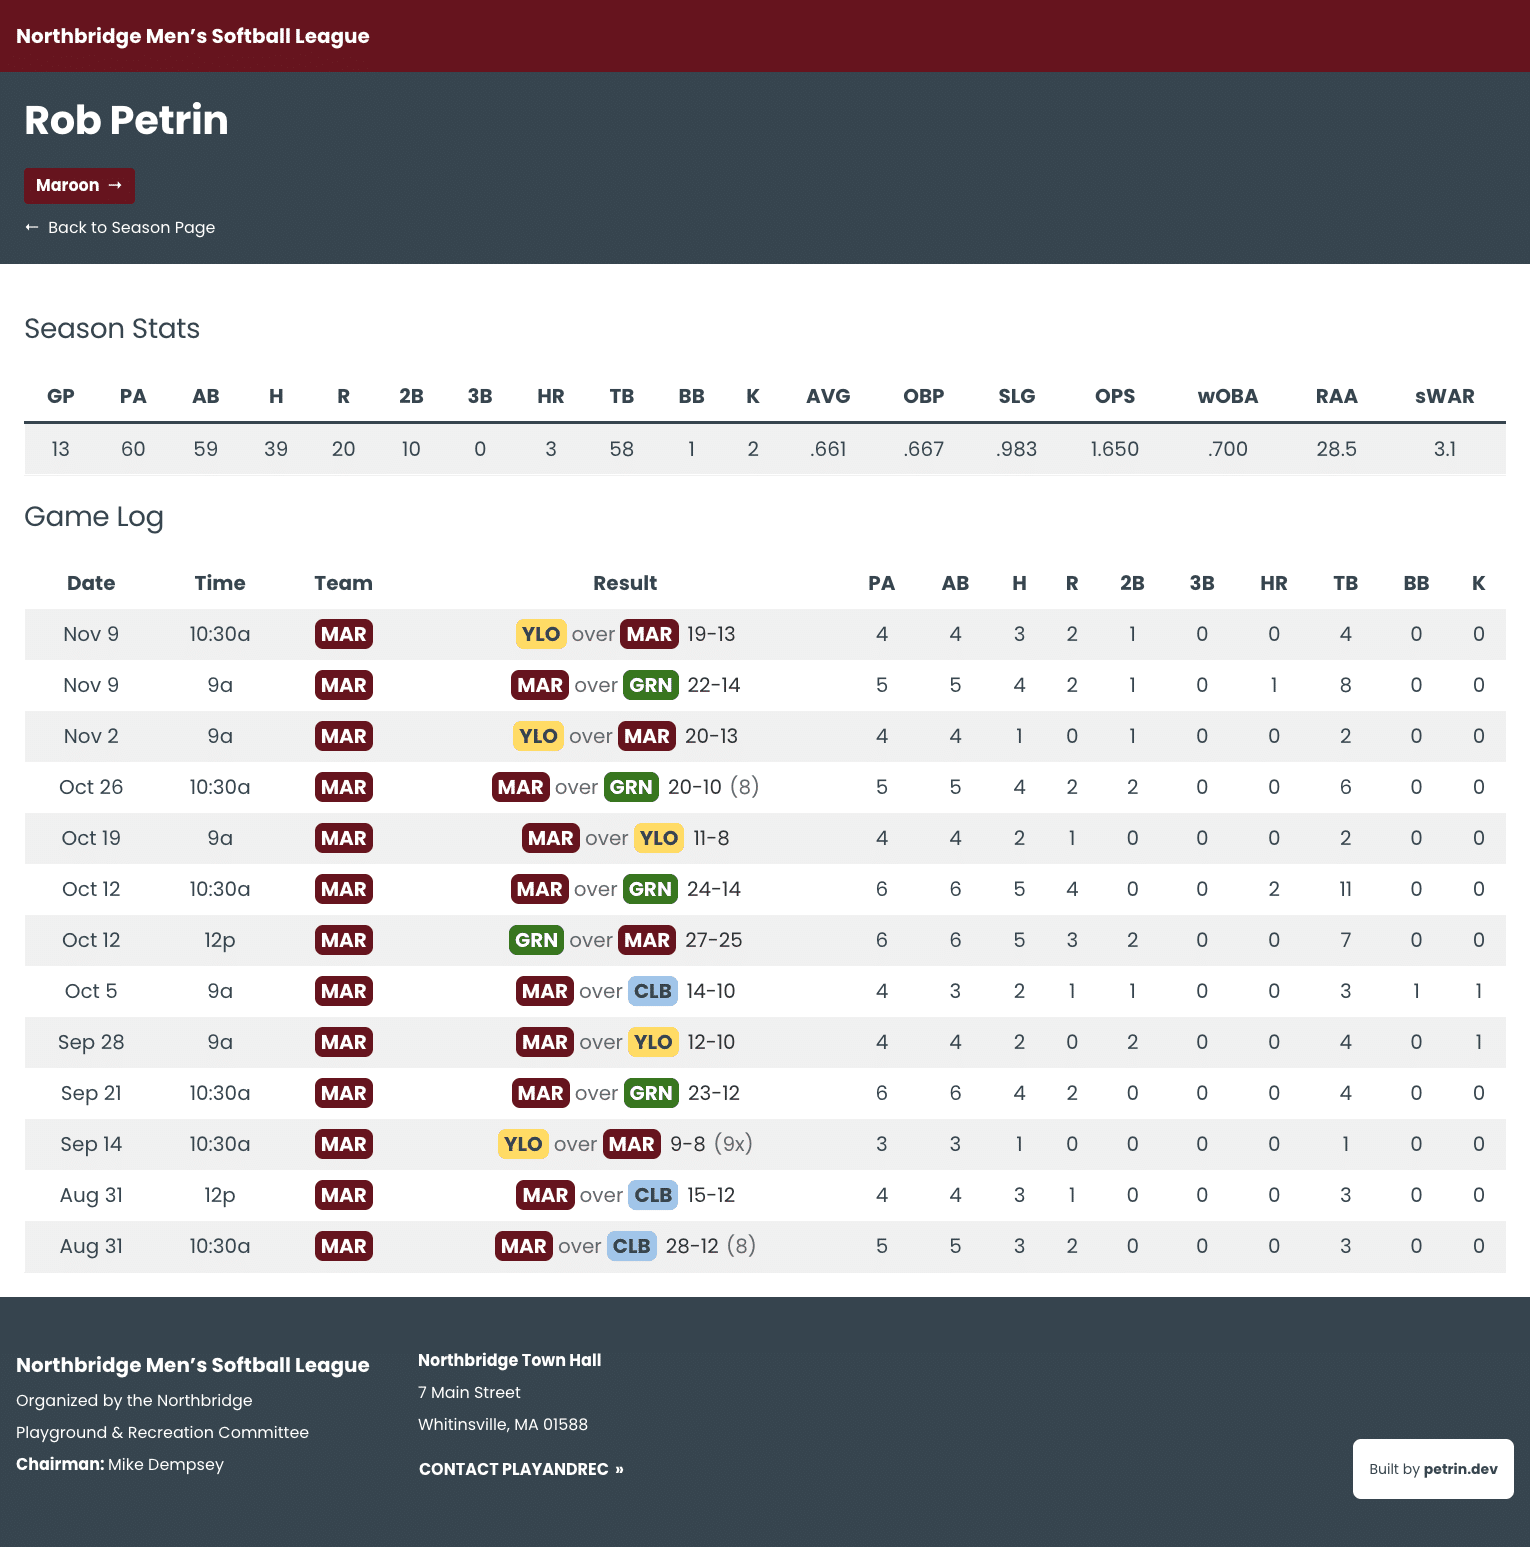
Player pages – Filtered by season parameter, showing team assignment, season totals, and game-by-game performance log
The color palette leverages team colors where contextually appropriate (like on team-branded player pages), with Northbridge’s maroon as the primary accent against blacks and whites. Stock photography provides some visual interest without custom photography budget.
The main design challenge: tables everywhere. Standings tables, schedule tables, statistics tables, boxscore tables. Rather than forcing complex responsive behavior, the solution was straightforward—horizontal scrolling on mobile devices keeps all data visible without breaking layouts.
The Development
A static site was briefly considered, but the requirement for live statistical calculations made WordPress the clear choice. Advanced metrics like batting average, on-base percentage, and slugging percentage needed to be calculated and recalculated as new game data was entered.
Custom Gutenberg blocks power the four template types:
Season Homepage blocks:
standings-table– Renders team rankings by win-loss record, win percentage, run differential, and other key metricsteam-grid– Outputs all child team-seasons for the current seasonschedule-observer– The sophisticated piece. Rather than a static schedule, each game has an encoded ID in the schedule table (like25f1,25f2). Before a game is played, the cell reads “YELLOW vs BLUE.” After the outcome is entered, it updates to “YELLOW def. BLUE, 16-12.” When rain-outs happen and games are rescheduled weeks later, the observer updates automatically without manual schedule adjustmentsstats-table– Displays player statistics with live-calculated advanced metrics
Game page blocks – Simple score display and per-team boxscore tables
Player page blocks – Team assignment, season statistics totals, and per-game stat log (all filtered by season parameter)
Team page blocks – Upcoming games, recent results, current roster, team stats tables, and record/standings position
Statistical calculations happen at the time of data entry when player performances are saved. As each game’s stats are entered, the system immediately recalculates all affected totals and averages. A cron-based calculation system may become necessary with scale, but with just four teams in the pilot season, real-time calculation at entry time performs efficiently.
The CSV import tools live in custom WordPress admin pages with friendly interfaces, allowing stat compilation from scorebooks into spreadsheets, then bulk upload into the system in minutes.
The Finished Product
The platform launched successfully for the Fall 2025 season. All four teams participated, with coaches providing their scorebook pages for weekly stat entry. The season has concluded, and the site remains live as a historical record and proof of concept.
The Future
Players who participate in both Northbridge and surrounding town leagues have expressed interest in bringing this statistics platform to other communities. While additional data entry isn’t exactly welcome, expanding the player database across multiple towns would provide a valuable scalability test for the architecture.
If expansion happens, it will be documented in a future case study.